Details of operation
COMET iterates sequentially through all user-specified clusters, generating statistics/visuals for one at a time.
Per-cluster program flow
- 1. Read in data from CSV.
- 2. Run t and XL-mHG tests on singletons.
- 3. ‘Slide’ XL-mHG cutoff values.
- 4. Generate discrete expression matrix using cutoffs.
- 5. Find cluster and population pair expression counts.
- 6. Run hypergeometric test on pairs using counts.
- 7. Calculate true positive/negative.
- 8. Export statistical results.
- 9. Generate and export visualizations.
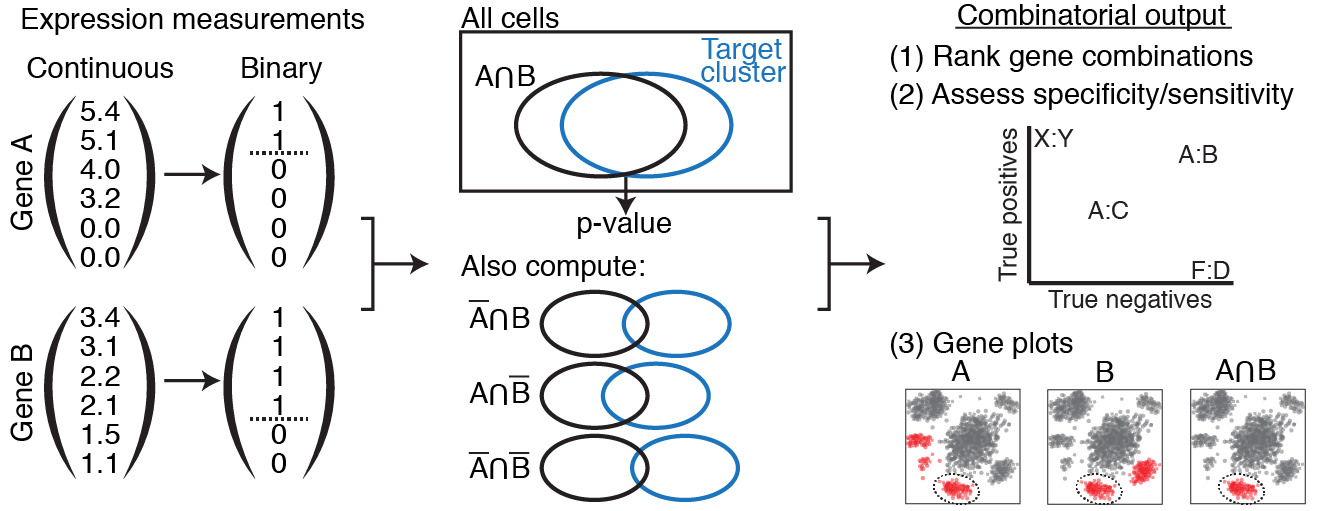
A simplified version of the program flow.
First, continuous expression values are converted to discrete via the XL-mHG test. Then, genes are combined and their combinations tests via the hypergeometric test. Finally, these combinations are ranked, assessed, and plotted.
1. Read in data from CSV.
User-specified data is read in via CSV format (currently, requiring comma delimiters.) See Usage for details of the format of this data.
There are three components:
- Per-cell gene expression values. Each gene must be normalized over cells.
- Cluster membership by cell.
- Per-cell 2-D tSNE values, for plotting.
In order to test ‘complement’ genes (i.e. expressed as the absence of a gene rather than the presence of a gene), COMET creates a new complement gene for each gene. These complement genes are treated exactly the same as normal genes, but their expression values are the negative of the expression values of their analogous gene. This allows COMET to find separate mHG cutoff values for genes and their complements.
2. Run t and XL-mHG tests on singletons.
For each gene, COMET first compares the cluster of interest with the rest of the population using a t-test, for comparison with XL-mHG results. The t-test measures the statistical significance of the continuous expression values of the cluster of interest if the cluster comes from the rest of the population. This assumes a t distribution of values (similar to a Normal distribution).
Then, COMET runs the XL-mHG test for each gene, comparing the cluster of interest with the rest of the population. This generates a hypergeometric test statistic measuring statistical significance, as well a ‘best’ cutoff for conversion from continuous to discrete expression values that best differentiates the cluster.
This cutoff is not in terms of a expression value, but rather a specific index in a list of cells sorted by their expression value (see the ‘program flow’ figure on the top of the page). Therefore, the exact expression value of a cell does not matter, only its position relative to other cells.
For example, an outlier cell with an expression value 10 times higher than any other cell will produce the same results as an outlier cell with an expression 10,000 times higher; all that matters is that the cell is 1st place in expression value.
Both these tests can only be run on single genes (‘singletons’).
3. ‘Slide’ XL-mHG cutoff values.
Since we cannot distinguish between cells of the same expression value, COMET needs to convert this cutoff index into an actual cutoff value. It accomplishes this by ‘sliding up’ the cutoff index in the sorted list of cells until the index encounters a different expression value.
For example, expression data often contains many cells that do not express the gene of interest at all. These cells have an expression value of 0. In the case that the XL-mHG cutoff index lands on a cell with 0 expression, COMET will ‘slide’ up the cutoff index in the sorted list of cells until it finds a cell with non-zero expression.
In this case, since cells cannot have negative expression, COMET will choose a cutoff value between 0 and the lowest non-zero expression value, sliding ‘upwards’ towards higher values. This results in a non-expression and expression group, where non-expression is exclusively 0-expression.
COMET will always slide ‘upwards’. In the above case of 0-expression, sliding ‘downwards’ and choosing a cutoff below 0 would create an non-expression group of 0 members; no cell expresses below 0!
The exception is if COMET reaches the ‘top’ of the list: if it chooses a cutoff value above any cell, the expression group will have zero members. In this case, COMET will turn around and slide ‘downwards’ until it finds a suitable cutoff value.
‘Complement’ genes are treated in the same way, even though their expression values are negative.
4. Generate discrete expression matrix using cutoffs.
Now that COMET has generated cutoff values for each gene, it converts the dataset of continuous gene expression to one of discrete gene expression: where expression is represented as a ‘1’, and non-expression as a ‘0’. This dataset is represented as a matrix: with genes as rows and cells as columns.
5. Find cluster and population pair expression counts.
To rank combinations of genes, we want to find their hypergeometric significance value, defining a gene combination as the union of multiple genes: a gene combination is expressed only if all component genes are expressed.
The parameters of the hypergeometric test are as follows: - Number of successes (i.e. number of expressing cells in the cluster). - Sample size (i.e. number of cells in the cluster). - Number of successes in the population. - Population size.
These parameters are usually referred to as k, s, M, and N, respectively.
Finding the parameters for gene pairs
First, consider a combination of two genes:
We can find the number of expressing cells of the pair in the cluster and in the population through matrix multiplication. COMET multiplies the discrete expression matrix (where genes are rows, cells columns, and values are either 0 or 1) by its transpose. This yields a square matrix whose rows and columns correspond to single genes.
Consider an element of this matrix product, where its row corresponds to gene ‘A’, and column to gene ‘B’. The value of this element is the dot product of the two rows corresponding to gene A and B in the initial discrete expression matrix. Since the values of these two rows are either 0 or 1, this dot product is the number of times that a 1 occurs in both rows at the same location (i.e. the same cell). Therefore, the dot product is the number of cells which express both gene A and gene B.
By taking this product of subsets of the discrete expression matrix, COMET then obtains the number of cells in the cluster that express both gene A and B, and the number of cells in the population that express A and B. This is done by limiting the columns of the discrete expression matrix to either the cells of the cluster, or the cells of the population respectively (where the population is the set of cells not in the cluster).
In this way, COMET finds the k and M parameters for the hypergeometric test. The s and N parameters are easily found by counting cluster members. COMET can therefore calculate the hypergeometric statistic for a pair of genes.
3+ gene combinations
Combinations of 3 or more genes are currently unimplemented in COMET. However, the hypergeometric parameters for 3+ gene combinations can be found by first considering a 2-gene subset of the combination. Take this 2-gene subset’s discrete expression matrix (i.e. the matrix with cells as columns and gene pairs as rows, with value 1 for a cell expressing both genes in the pair, and 0 otherwise), and multiply it by the transpose of the single-gene discrete expression matrix.
This yields a matrix where each element is the number of cells which express the 3-gene combination correspond to its location’s gene pair and single gene; using this method, then, k and M can again be found.
6. Run hypergeometric test on pairs using counts.
Using these parameters, COMET then finds the hypergeometric test statistic for all possible gene pairs (including complement genes). The relevant test statistic is the ‘survival function’, which measures the probability that a randomly selected cluster of the same number of cells as our cluster of interest will have the same number or greater of expressing cells.
The ‘best’ genes therefore minimize this statistic; COMET ranks all gene singletons/combinations by this statistic.
7. Calculate true positive/negative.
Once COMET has calculated the hypergeometric statistic, it finds true positive and true negative rates associated with each gene singleton/combination, using the matrix products found earlier.
True positive is found by dividing the number of expressing cells in the cluster by the total cell count of the cluster; true negative is found by dividing the number of expressing cells outside the cluster by the total cell count outside the cluster.
Using the hypergeometric notation discussed earlier, we can write:
8. Export statistical results.
COMET’s statistical results are exported to two CSV files per cluster: one including statistical values for exclusively singletons, and one including all combinations. Rows are genes or gene combinations, columns are values associated with that gene/combination.
The columns of the singleton statistical data are:
gene: the name of the gene.HG_stat: the hypergeometric test statistic. Genes are ranked using this value.mHG_pval: the statistical significance of the cutoff which the XL-mHG test has chosen.mHG_cutoff_index: the index which the XL-mHG has chosen, after sliding.mHG_cutoff_value: the gene expression cutoff value corresponding to the chosen index.t_stat: the t-test statistic.t_pval: the t-test p significance value corresponding to the test statistic.TP: the true positive rate.TN: the true negative rate.rank: sequential ranking based onHG_stat, where lowerHG_statis better ranking. No two genes are ranked the same; those with identical hypergeometric statistic values are ranked arbitrarily relative to one another.
The columns of the combination statistical data are the same as those of the singleton data with some exceptions:
geneis replaced bygene_1andgene_2(combinations of 3+ genes are unimplemented as of yet).mHG_pval,mHG_cutoff_index,mHG_cutoff_value,t_stat, andt_pvalare omitted, since they are irrelevant to non-singletons.
9. Generate and export visualizations.
For each cluster, COMET generates five PDF files containing visualizations of the statistical results. Each PDF``s name is prefixed by the cluster name, and includes visuals for only the first few highest ranked genes/combinations.
The PDF files are:
(cluster)_combined.pdf: compares discrete expression and continuous expression for each gene in a combination on a tSNE plot.(cluster)_discrete.pdf: compares discrete expression of a gene combination with that of its components.(cluster)_TP_TN.pdf: plots true positive/negative rates of each gene.(cluster)_singleton_combined.pdf: same as thecombinedplot, but includes only singletons.(cluster)_singleton_TP_TN.pdf: same as theTP_TNplot, but includes only singletons.